Identify Any Tree in New York City With this Map
What kind of trees grow in your neighborhood?

Though we may like to think that we know the secrets of the blocks we live on, we may be missing far more information than we realize. Can you name, for example, the number of trees that line your block? What about each kind of tree that grows on your block?
Sure, you may know what the tree outside your window looks like, but what kind of tree is it? What kind of trees are on either side of it? If you live within the bounds of New York City, this tree map has all your answers.
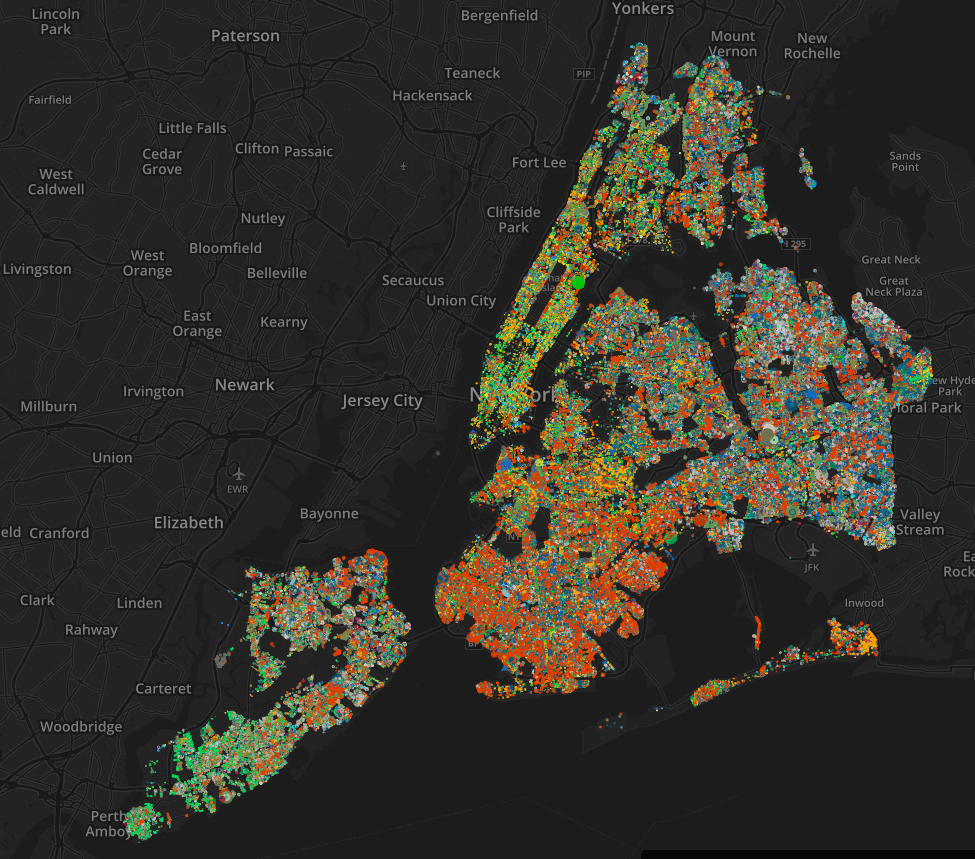
Using the last tree census data (yes, there’s a tree census) from 2005, Brooklyn-based web developer Jill Hubley created an incredibly detailed map of all of the street trees in New York City. In theory, each tree on every street in the five boroughs is represented.
Each dot on Hubley’s map is roughly proportional to the diameter of the tree trunk.
“Initially my thought was to make a map of the trees in [Brooklyn’s] Prospect Park because I walk there everyday with my dog, and I like to know what’s around me,” explains Hubley. “After doing some research, though, [I found that] a census of the trees in Prospect Park hadn’t been done, but one existed for the city’s street trees.”
Mapping the tree data came with its fair share of challenges, however. “The parks department uses a four-letter code to identify the trees, but they don’t include a data dictionary,” says Hubley. After deciphering the code, Hubley had to find an approach that would let her map more than 600,000 data points without crashing the browser.
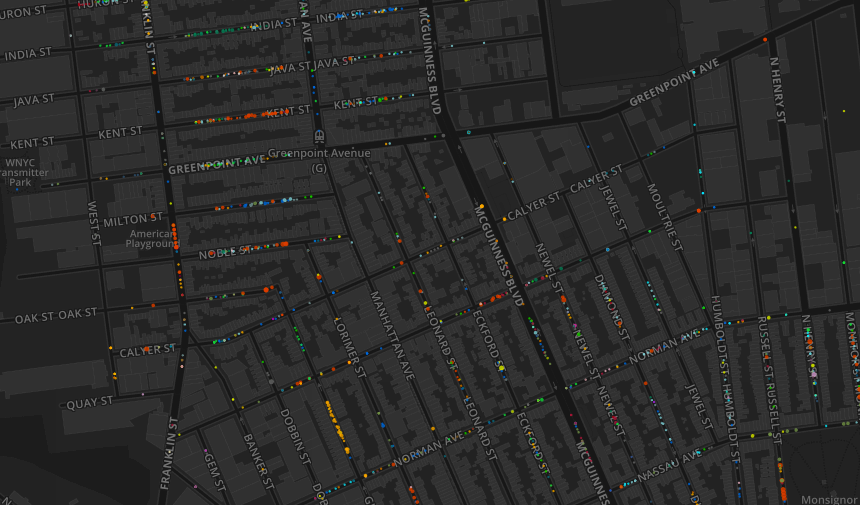
The data itself is fascinating, and lets you identify both the species of trees you see every day, or find where certain trees, like Japanese pagoda trees, grow across the city. The map is interactive, and allows you to zoom in and out, or toggle to see the distribution of specific trees. You can also opt to remove the base map of the streets for more abstract viewing.
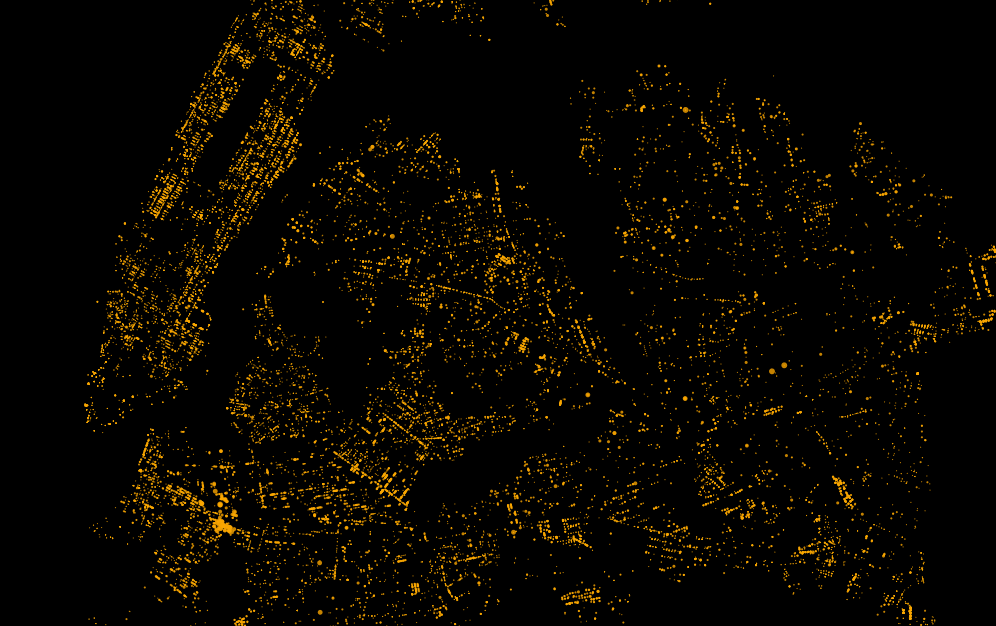
The map is interactive: you can choose to see the distribution of only one kind of tree, and opt to remove the base map. The above images shows the distribution of honeylocusts in Brooklyn, Manhattan and Queens.
It turns out that there is a precise methodology that goes into the decision of where to plant different trees in the city. If there are wires overhead, the department chooses to plant trees that will not grow to be very tall, Hubley explains.
There are many factors to consider. The Parks Department has identified 18 habitats, called biotypes, around New York City. Different types of trees flourish in different biotypes, so the species that best fit the surrounding environment are the ones that are planted there. ”The biotopes include things such as soil compaction, tree bed size, and height available,” says Hubley.
A new tree census was conducted last year, and its data will available later in 2016. Hubley intends to update her map, which relied on the last 2005 census, once the new data is unveiled, so that we can continue to look at spaces that are familiar to us, and learn something new about the trees we see every day.
Map Monday highlights interesting and unusual cartographic pursuits from around the world and through time. Read more Map Monday posts.


Follow us on Twitter to get the latest on the world's hidden wonders.
Like us on Facebook to get the latest on the world's hidden wonders.
Follow us on Twitter Like us on Facebook