How Marshall Islanders Navigated the Sea Using Only Sticks and Shells

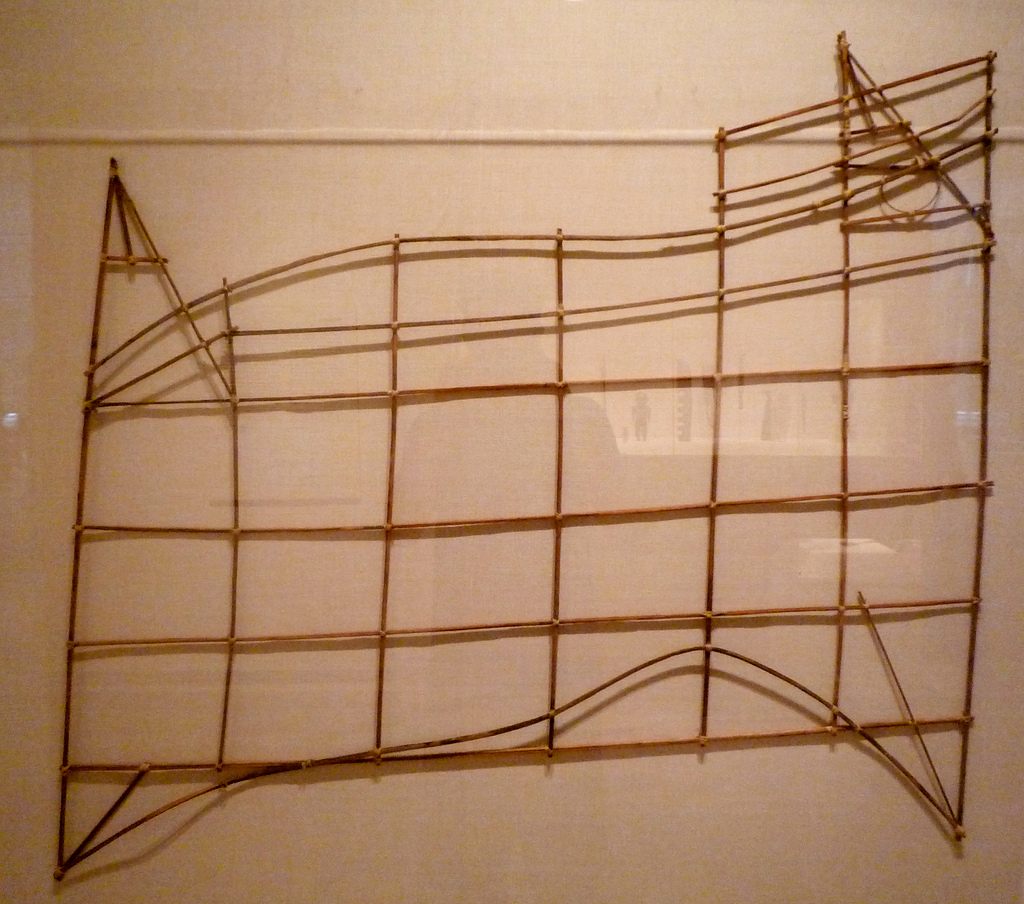
Obviously these sticks and shells are a sea chart. (Image: brewbooks/Flickr)
If you live in a country consisting of over 1,100 islands spread across 750,000 square miles, how do you navigate the sea in between? Easy: with sticks and shells.
The stick charts of the Marshall Islands, in use since they were first inhabited in the 2nd century BCE, are simple-seeming navigational tools that look like little more than a bunch of twigs arranged into a loose lattice. They guide voyagers by depicting the waves and islands they are likely to encounter along the way. But unlike most maritime maps as we understand them today, the delicate stick charts were not brought on sea voyages. Instead, they were studied by the sailors prior to the trip. The directions and swells would be memorized by the mariners, who would then navigate without them.
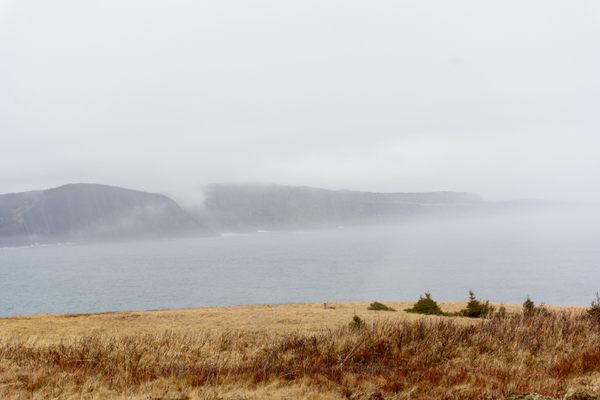
Look out for that southern wave. (Image: Jason Eppink/Flickr)
The use of Marshallese stick charts was not brought to popular modern attention until a missionary’s report in an 1862 edition of The Nautical Magazine. In the piece, American Protestant missionary Reverend L.H. Gulick described the island inhabitants creation of “rude” maps that described the location of other islands, nearby and afar, using stick formations to delineate wave patterns and oceanic activity.
While Gulick was correct about the charts describing wave activity, they were not made out of sticks per se. The charts were traditionally made from coconut fibers, the sturdy midsection of coconut tree fronds, and small shells like cowries. Gulick undoubtedly used navigational charts, sextants, and other complex Victorian tools of the day to reach the islands but the rustic charts he discovered among the Marshall Islanders may have been just as complex, if not moreso.
The “stick charts,” as they are popularly known regardless of actual make-up, can be broken up into three distinct categories, all of which are dependent on swells, or dependable wave activity not caused by local winds, but by the interaction of static currents and land which deforms the waves. To put it simply, the charts told people where to go based on reliable ocean movements instead of landmarks like on land.
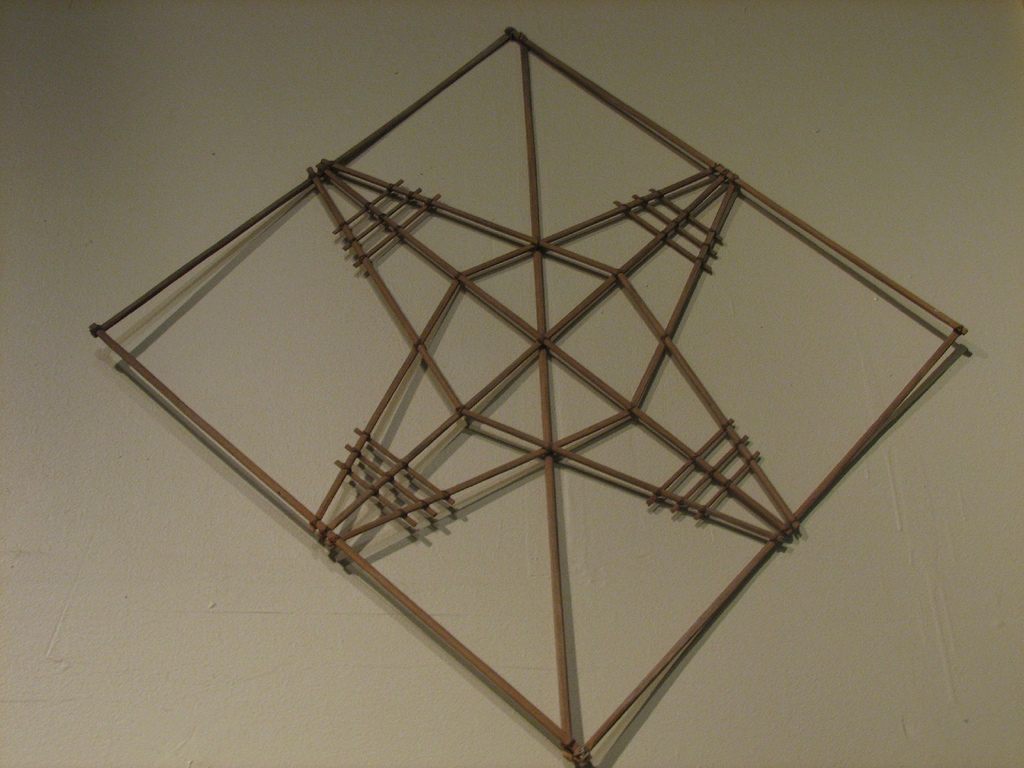
A mattang. (Image: jmcd303/Flickr)
The first type of chart was known as a mattang. These charts were generally smaller and used mainly for instruction in the swell patterns of specific voyages, or in how to read a specific swell. These were often more abstract and symbolic, made by specific sailors for personal use, making them a bit more esoteric to the outsider. In these, as in all stick charts, the lines could be straight or curved or intersecting to represent the motion of the waves.
The second type of chart was the medo chart which generally showed the relative position of a small number of islands to one another, and how their landmass’ swells presented and/or interacted. Unlike the mattang chart, the medo, was more concerned with the concrete position of islands, although again the oceanic swells were used to aid in navigation.
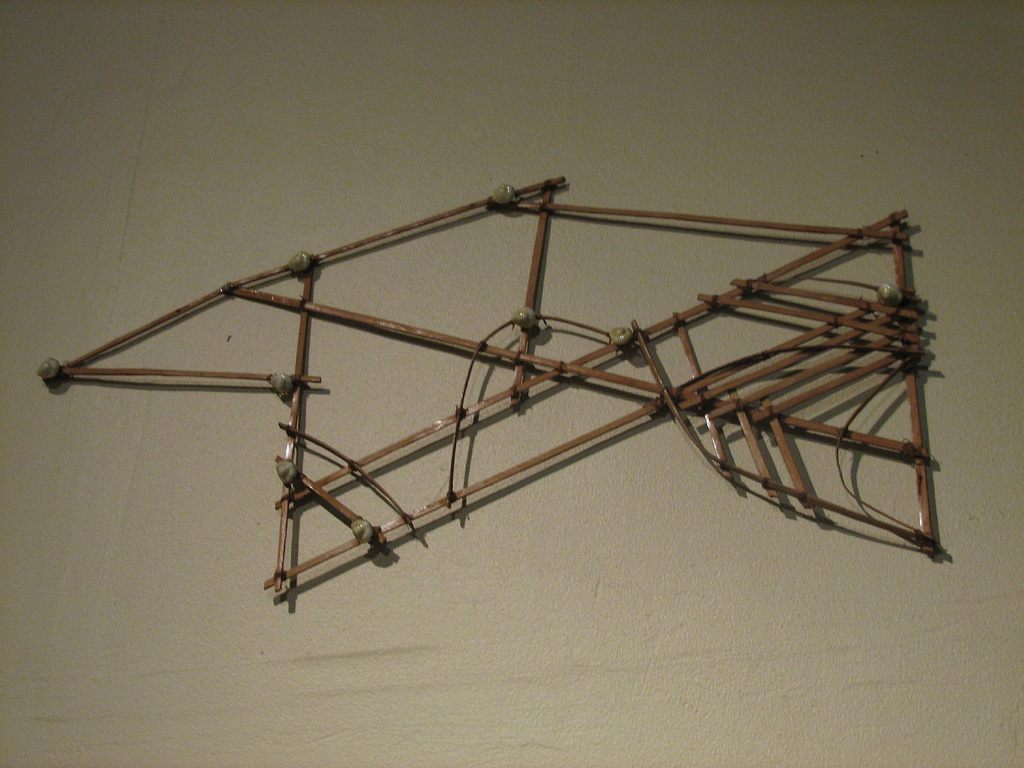
A medo. (Image: jmcd303/Flickr)
Finally the most far-reaching type of stick chart was the rebbelib, which covered a much wider area, and a great many more islands. These charts, with their greater number of intersecting points often looked like a loose mesh of criss-crossing lines, dotted with shell markers. Some of these charts, which were not made to scale, could cover nearly the entirety of the Marshall Islands, which are spread over 750,000 square miles of the Pacific.
The stick charts, their language and craft dating back centuries, are impressive both for their complexity and their accuracy. While they can be interpreted by outsiders, they are all but unreadable from a practical standpoint by those who did not grow up on the Marshall Islands, sailing the waters between the little bits of land. Even among islanders, the skills of making and reading the charts were held among select members of each community who would lead large sailing parties.
According to a 2015 Smithsonian article, in 2005, a graduate student studying the stick charts was taken out to sea by a navigator from the Marshall Islands, who asked him if he could feel the subtle swells as they passed over them. The student could not. It is this understanding of oceanic activity as topography that makes reading the stick charts even more challenging.
After centuries of use among the indigenous people of the Marshall Islands, the creation and use of stick charts began to dwindle in the late 19th and early 20th centuries as more modern forms of navigation from sextants to GPS made their way to the islands. The decline of the tradition was also helped along by the stringent information control surrounding the traditional navigation techniques. Since the knowledge was limited to only a few members of each community, as they died, so did their unique understanding of the craft.
Navigation by stick chart may be a mostly forgotten art, but many of the delicate navigational tools have survived. The Science Museum at the University of Cambridge has a collection, as does the British Museum. Stateside, you can find stick charts at the Met in New York and the Museum of Fine Arts in Boston, while, in the southern hemisphere, the National Library of Australia and New Zealand’s Te Papa Museum both have them in their collections.


Follow us on Twitter to get the latest on the world's hidden wonders.
Like us on Facebook to get the latest on the world's hidden wonders.
Follow us on Twitter Like us on Facebook