Mapping the Hidden Movements of Baboon Troops
What researchers have learned from tracking 57,000 individual “baboon decisions.”
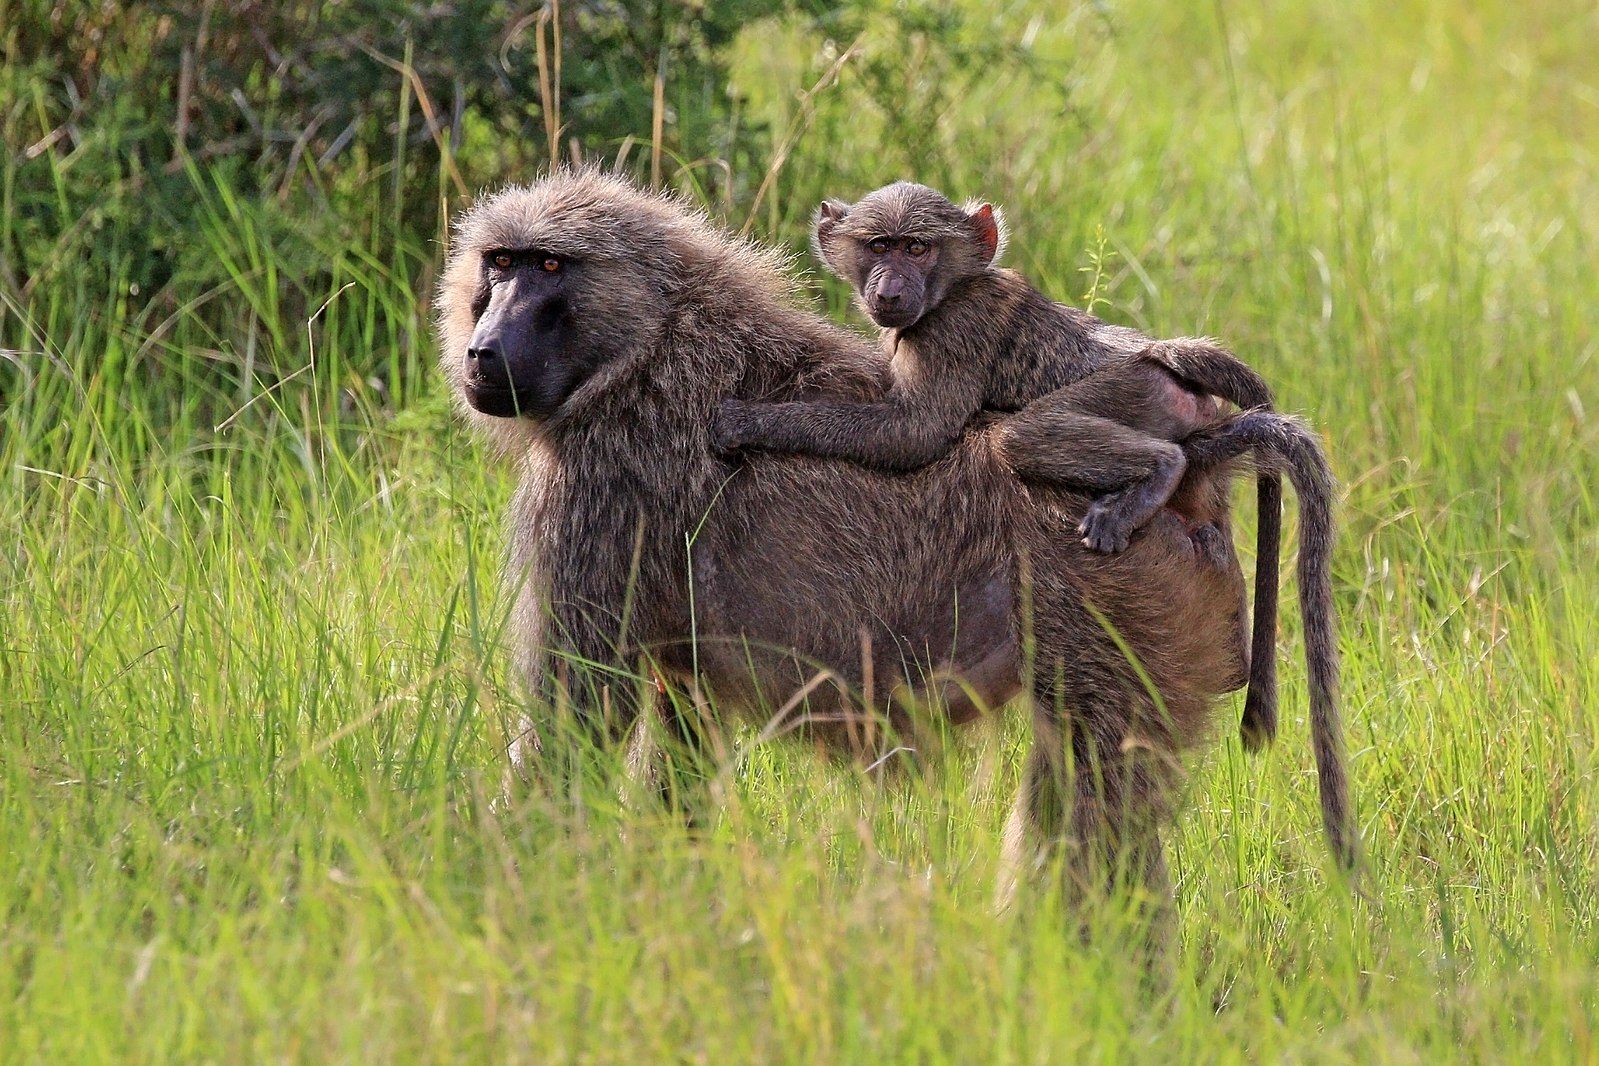
On August 1, 2012, at around 7 a.m., the members of an olive baboon troop living in central Kenya’s Mpala Community Conservancy woke up, climbed down out of their sleeping trees, and started into their morning routine. For the first hour or so, they moved slowly, the adults grooming each other as the youngsters horsed around. It was early, after all.
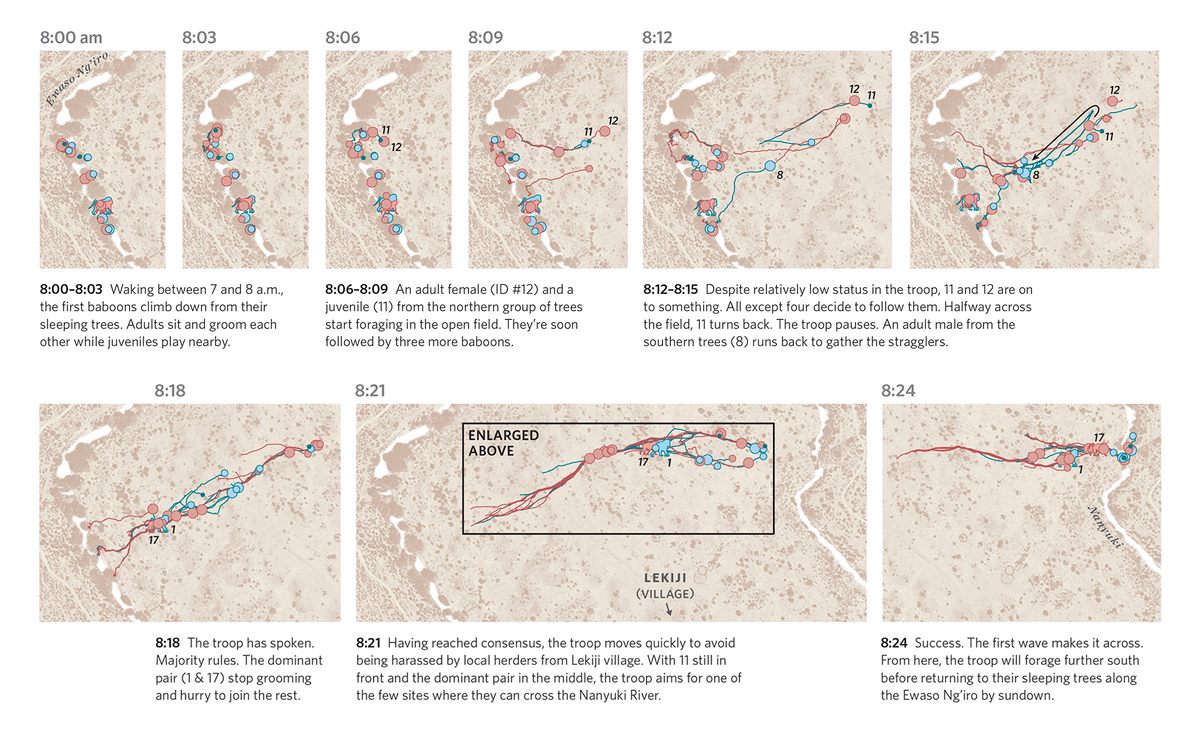
But then, around 8:06 a.m., an adult female and her young son got hungry. They set out together into a nearby field to forage. Over the next few minutes, almost all of the other troop members stopped their grooming and playing and followed the two trailblazers. By 8:15, dozens of baboons of all ages had formed a kind of parade behind the pair, with one older male even circling back to pick up stragglers.
For the rest of the morning, the whole troop trekked through the conservancy area: snacking, hurrying through pastureland, and eventually crossing the Nanyuki River, the mother and son leading the way for the majority of the time.
For the baboons—who spend many of their morning hours searching for food—this was an ordinary start to an ordinary day. For mapmakers James Cheshire and Oliver Uberti, though, it was a kind of microcosm: a tiny moment that, if visualized properly, could unlock a number of fascinating truths about how baboons live.
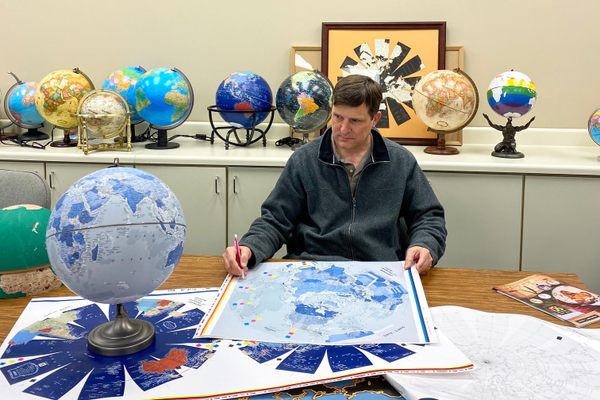
Cheshire, a geographer, and Uberti, a designer, previously teamed up for London: The Information Capitol, a book of maps and infographics that lay out various hidden aspects of the city. For their new book, Where the Animals Go, they turned these talents to a new, equally rich data source: animal tracking projects, which trace individual creatures as they move through their habitats, interact with surrounding ecosystems, and even—in the case of long-migrating Antarctic albatrosses—circle entire continents.
Studies like this used to be the province of luck or high-effort gambles—coming upon pawprints in the dirt, say, or attaching a radio transmitter to a duck. Over the past few decades, though, various incarnations of GPS technology have allowed scientists to start keeping close tabs on everything from whether endangered elephants are safe, to how mountain lions bypass highways, to when ants in a colony perform their jobs, all of which Cheshire and Uberti were able to include in the book.
But the baboons presented a unique challenge. “In many cases, we’re drilling down to show a specific, individual animal’s movement,” says Uberti. “The baboon study gave this great opportunity to show how an entire group of animals can be tracked, and how individual decisions help them move as one.”
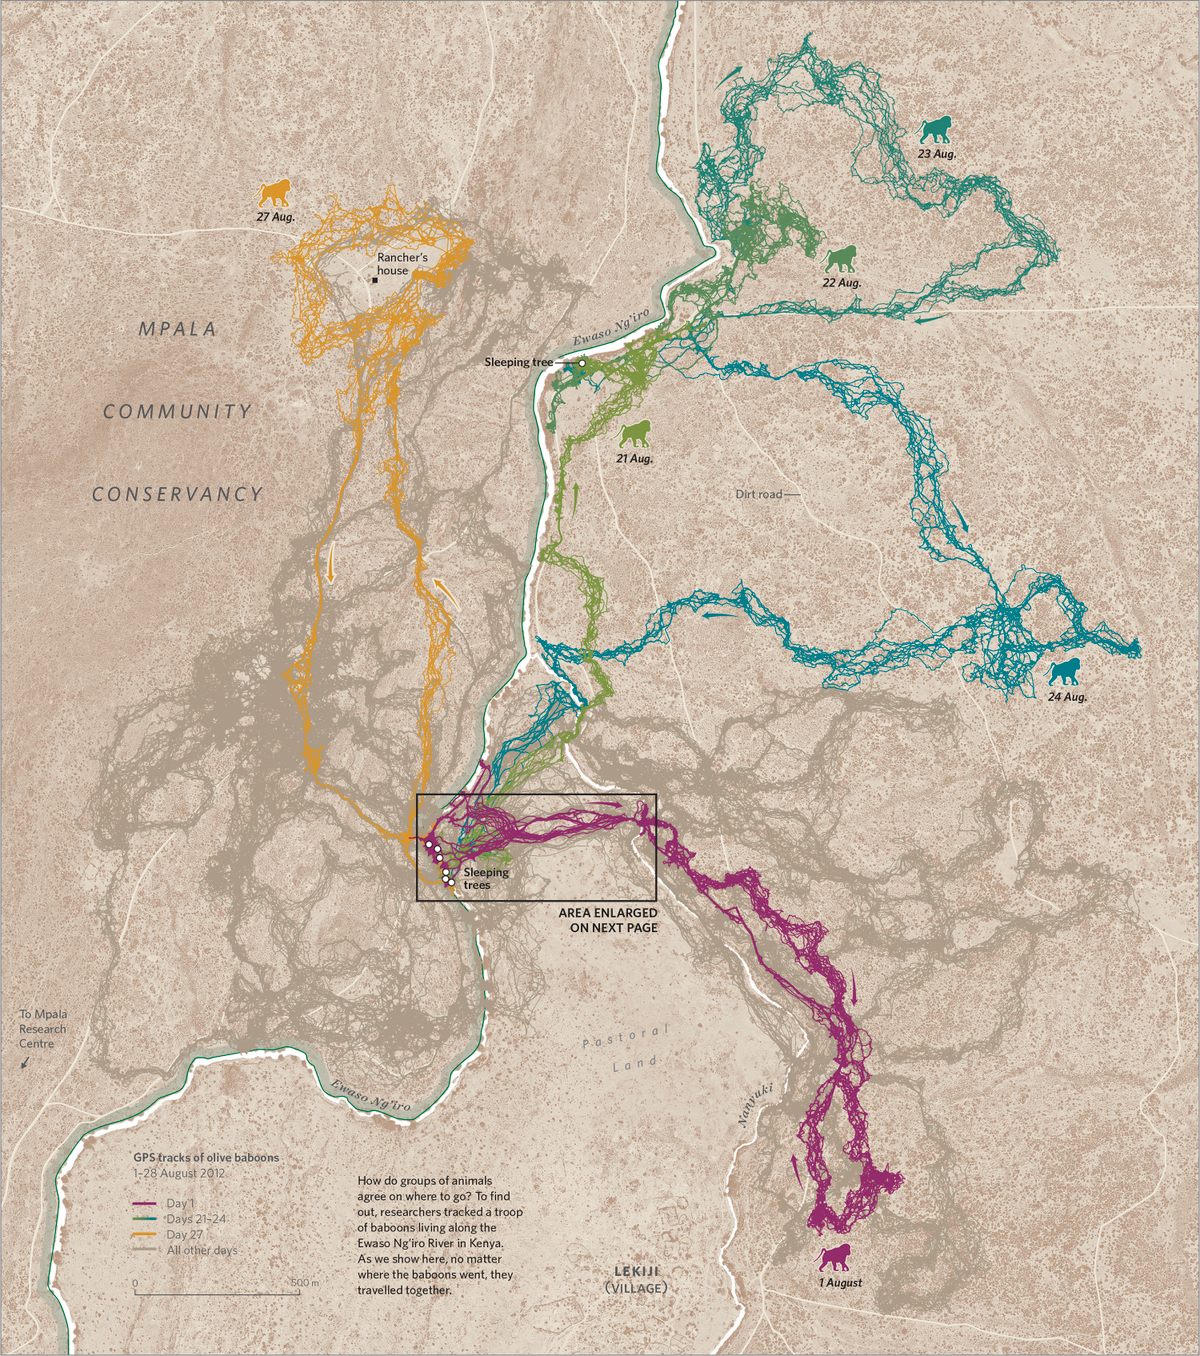
The baboon map above is based on data gathered by Margaret Crofoot, an anthropologist who studies how social systems evolve. In 2012, she and her team of researchers put tracking collars on 25 baboons living in the Mpala Conservancy. They were trying to figure out exactly how the troop—which, like all olive baboon troops, generally moves as a unit—collectively decides where to go. Were they led by alpha males and females, the high-level troop members who generally get their pick of mates and meals? Or was there something more complex going on?
Crofoot and her team tracked the baboons for four weeks, recording each of their positions once per second. They then teamed up with two other collective behavior researchers, Damien Farine and Ariana Strandburg-Peshikin, who wrote software that condensed these millions of data points into 57,000 individual “baboon decisions”—a bold change of direction, say, or a folding back into the group.
By analyzing these decisions, the researchers found that baboon troops move via a complex kind of consensus. Any single baboon that decides to go in a particular direction might “pull” a few others along, forming a group that is all going one way. Often, a couple of these cliques will form at the same time. If the resulting groups of baboons disagree about which way to go, but both want to move in the same general direction, the troop will split the difference, traveling down the middle of the proposed paths. If the difference in direction is more stark, majority rules.
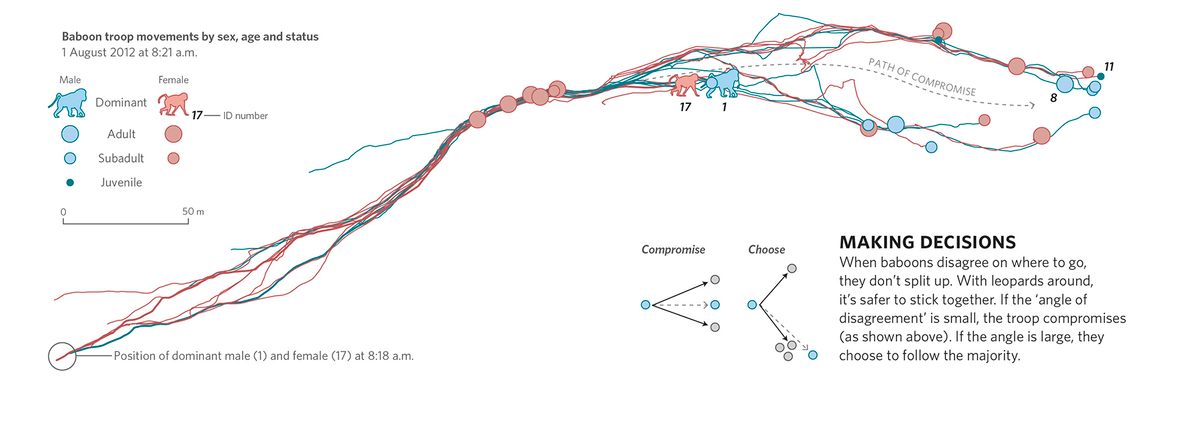
In this way, individuals take turns leading the group, simply by being proactive. Despite the presence of alpha individuals in the group, this type of directional leadership didn’t depend at all on dominance, sex, or age: a mom and her young son were just as likely to set the day’s trajectory as anyone else. As Crofoot told Uberti and Cheshire, “all group members have a voice.”
In 2015, the researchers published their findings in Science. Soon after, Uberti and Cheshire decided to include them in their book. With millions of data points to work with—what Uberti describes as “a huge hairball”—this was an entirely different challenge. “It took a lot of manual effort to go in and say, ‘OK, what is the story here?’” he says. “What are the interesting movements?”
They ended up focusing on a few different days’ journeys, drawn in different colors in the map above. Taken together, they give a visceral snapshot of group baboon life. Each day, the baboons explore a different swath of territory, venturing out to find food and then looping back to a stand of trees to sleep.
Meanwhile, landmarks that might help anchor humans in the landscape—say, the research center itself—are conspicuously absent, replaced by the rivers they need to cross, the dirt roads they frequently use to commute, and the sleeping trees they eventually make their way back to. “What we’re interested in showing is stuff that’s important to the animals, not necessarily stuff that’s important to the humans,” says Cheshire.
For example, on August 1—drawn in purple on the map—the whole troop crossed one of those rivers, traveled south for about a mile, and then took a slightly different path back home. And from August 21 through August 24—traced in different shades of blue and green—a leopard was hanging out near their usual home base. “They didn’t come home for a few nights,” Uberti says. Then on August 27—the gold loop—“they go up and take a little trip to this rancher’s house.” Throughout, the skinny trails of individuals join into big clumps, as the troop as a whole deals with different challenges and opportunities.
But there was still the question of showing this decision-making process in detail. With Farine’s help, they found the small story from the morning of August 1, of a mother and son leading the charge. “It really exemplifies what the research has demonstrated,” Cheshire says. They mapped that half hour as a kind of play-by-play, demonstrating the principles the researchers had uncovered in action. “The beauty of print is that it allows us to slow time down, and allows you to look and see how the baboons, step by step, are influencing each other,” says Uberti.
In this way, a huge amount of data became both a map and an illustrative moment. “We talk about big data all the time,”says Uberti, “but sometimes it’s small data that communicates the story more effectively.” Small data about a small baboon and his mom.
*All map images reprinted from Where the Animals Go: Tracking Wildlife with Technology in 50 Maps and Graphics by James Cheshire and Oliver Uberti. Copyright © 2017 by James Cheshire and Oliver Uberti. With permission of the publisher, W. W. Norton & Company, Inc. All rights reserved.


Follow us on Twitter to get the latest on the world's hidden wonders.
Like us on Facebook to get the latest on the world's hidden wonders.
Follow us on Twitter Like us on Facebook